Constellations: how the Stellar ecosystem connects
Constellations, the second Lumen Loop Labs experiment, is an interactive graph of the Stellar ecosystem: the projects, the content we publish about them, their SCF awards, and the themes that connect them.
Constellations is the second experiment in Lumen Loop Labs, our space for small tools built on the ecosystem data we already collect. It is an interactive graph of the Stellar ecosystem: the projects, the articles, videos and events we publish about them, the SCF awards they have won, and the themes, categories, regions and funding rounds that tie them all together. Live at https://labs.lumenloop.com/constellations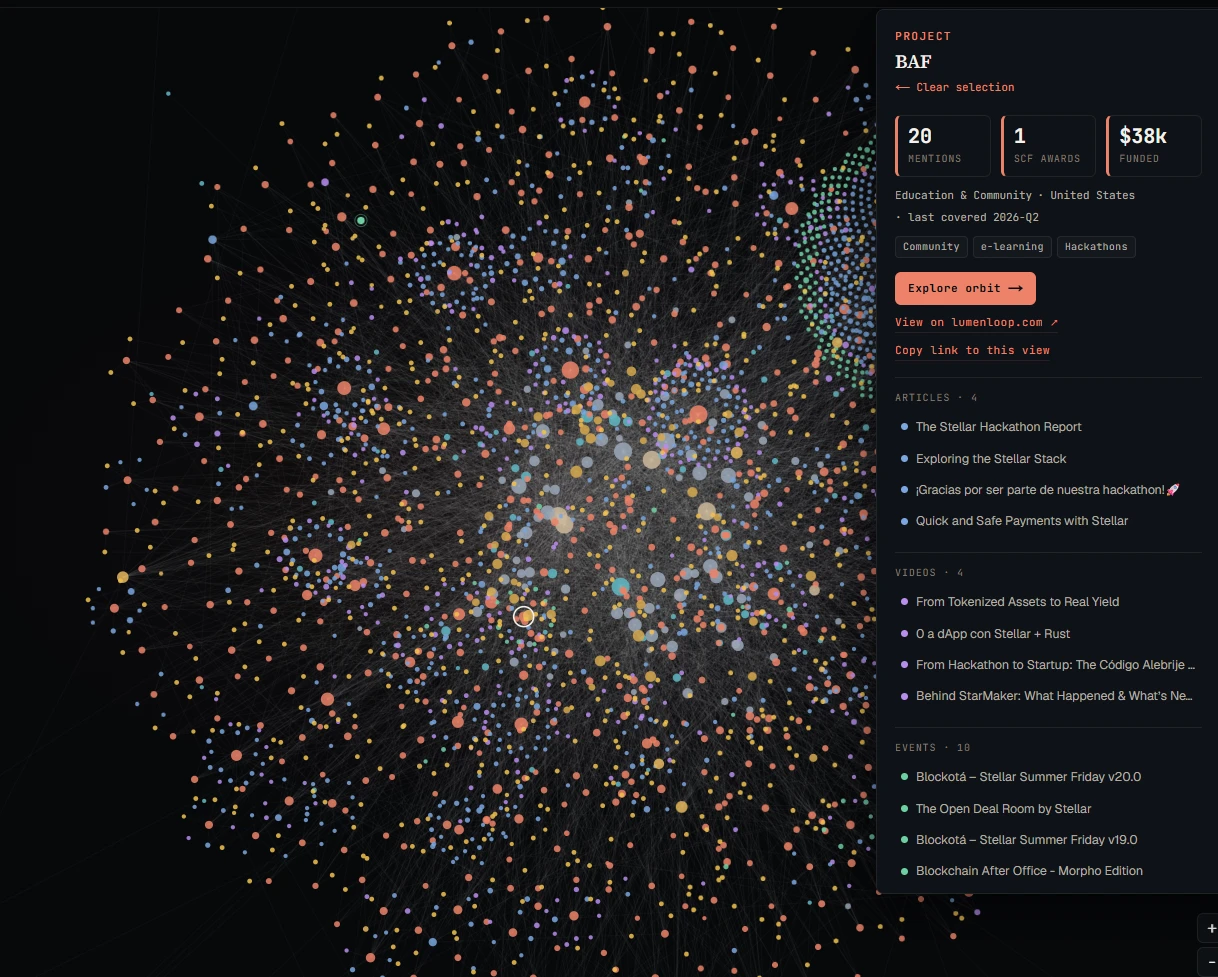 The graph pulls everything we track into one connected view, with four ways to read it. Orbit lets you pick any project or theme and see its immediate neighborhood, then click a neighbor to recenter and keep exploring. Gravity packs every project into a field of bubbles, sized by how much coverage or funding it has and colored by how recently we covered it, so a funded project we have not written about yet is easy to spot. Genesis plays a decade of the ecosystem assembling itself over time. Spectrum breaks down what the Stellar Community Fund actually builds, by theme.
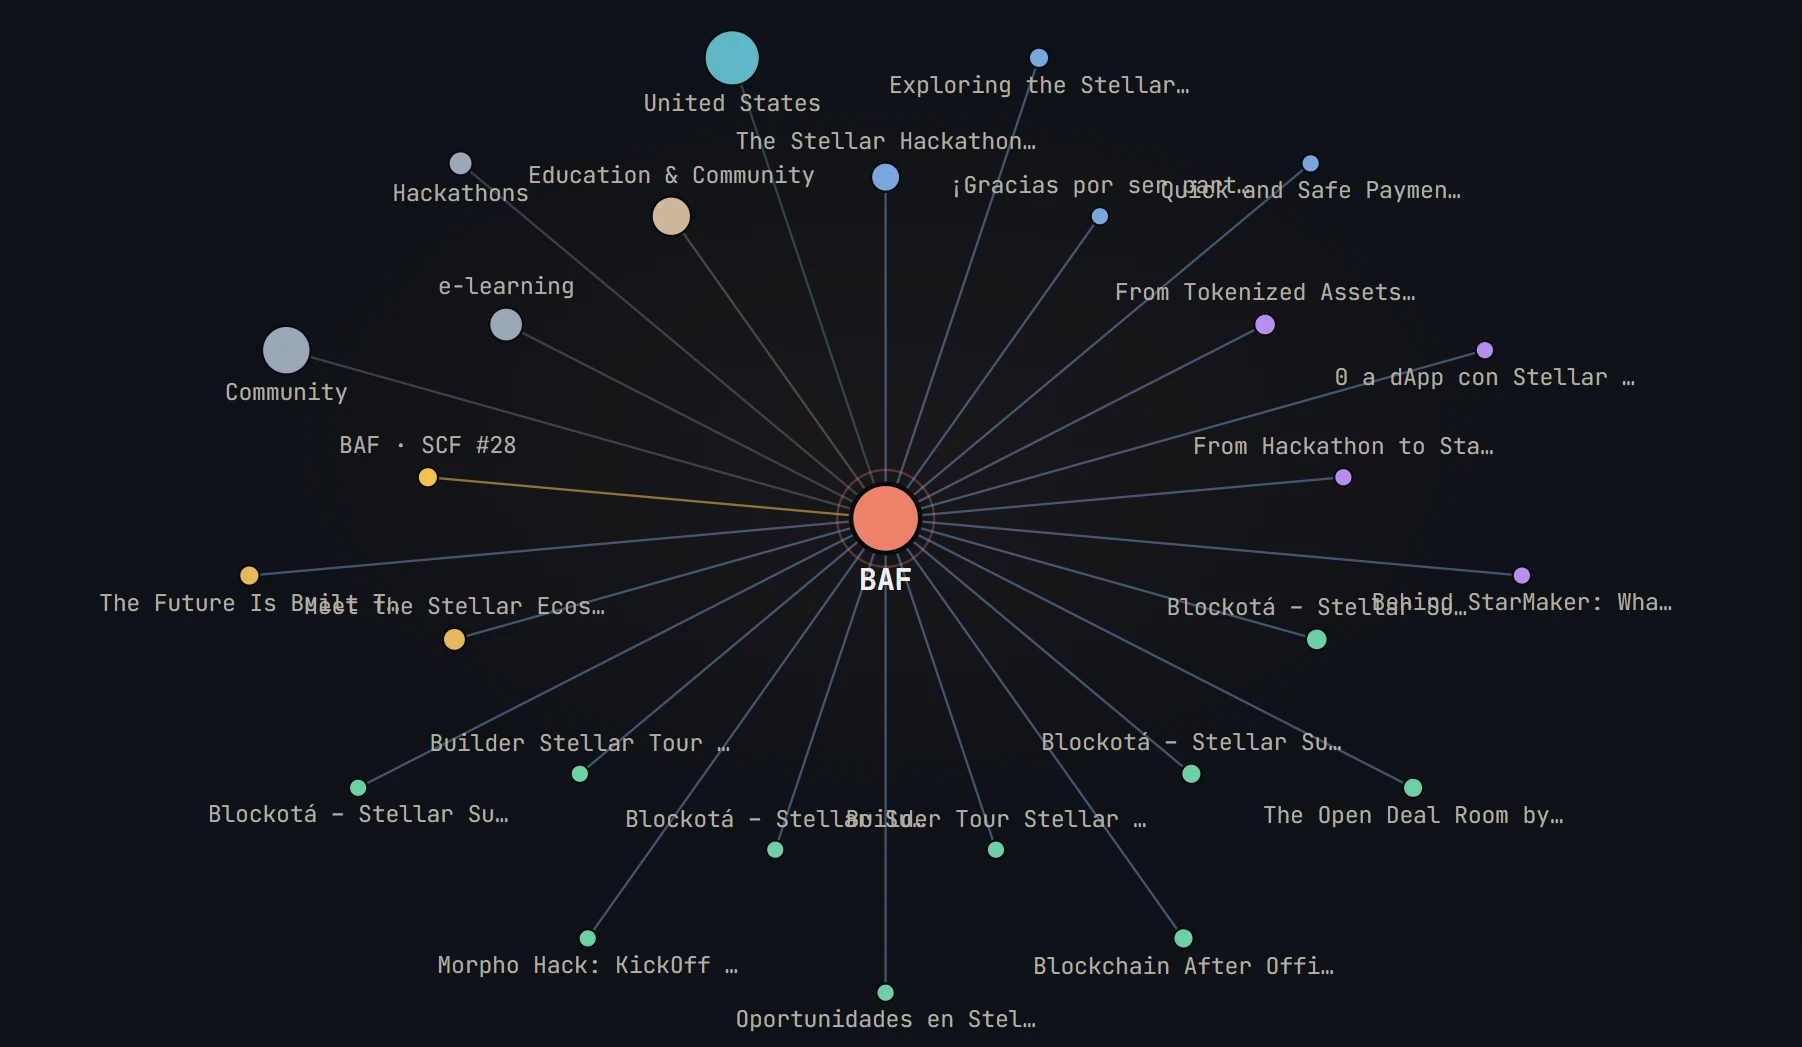
You can search for any project or theme, click to explore, zoom and pan with the wheel, a drag, or a two-finger pinch on your phone, and share an exact spot, since every view and selection lives in the URL.
The value is the same as a map. A directory or a funding table shows one row at a time and is hard to read as a whole. As a graph, the structure shows up: which projects are hubs, which themes cluster together, what we have funded but not yet covered, and how the whole thing grew. It is a different way into the same data, and a starting point for questions a list does not surface.
More experiments will follow.